

New research from Nosto and an analysis of more than 1.2 billion site visits across online fashion retailers, provides valuable insight into the state of fashion e-commerce in 2019.
With a “retail first” approach, the most successful online fashion retailers are finding new ways to engage fashionistas, provide personal shopping experiences, and create sales growth.
7 key fashion e-commerce metrics

Nosto identified seven key metrics for emerging fashion e-commerce leaders, including: traffic share by device; revenue per visit (RPV); basket size; conversion rate (CR); average order value (AOV); cart abandonment rate (CAR); and time spent per visit.
Retailers analyzed were primarily in the regions of North America, United Kingdom, Nordics (Denmark, Finland, Norway, and Sweden), France and DACH (Germany, Austria and Switzerland).
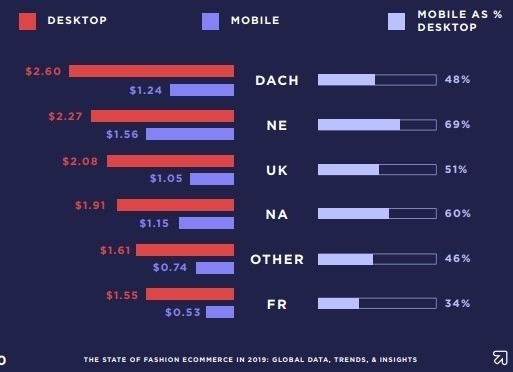
Revenue per visit grew on desktop and mobile
In 2018, average revenue on desktop grew 33% and on mobile 38%, impressive results for any business, including the notoriously fickle fashion industry.
Globally, desktop is still generating the highest return per visit (RPV) at $2.76, where mobile lags behind at $1.44.
“Conversion rates (CR) increased over time (over 2018, mobile CR increased from 1.2% to 1.5% while desktop CR increased from 2.2% to 2.7%). Global cart abandonment rates (CAR), however, remained relatively stable with only a slight spike around Black Friday/Cyber Monday: this implies that higher conversion rates are not moving inversely with cart abandonment rates,” the report said.
Retailers need to emphasize shopper personalization to upsell and cross sell in order to increase average order value and revenue per visit.
Fashion e-commerce hit the mobile tipping point globall
Average order values are converging on devices as well with mobile reaching 86% of the average order value (AOV) of desktop sales in 2018. Revenue per visit (RPV) is still smaller on mobile at 52% of desktop RPV.
As mobile traffic and AOV grow, increasing conversion will have a strong positive effect on revenue per visit and profitability.
Fashion shoppers aren’t changing their browsing behavior much – however…

The average time, consumers spent on fashion websites remained flat for both mobile (165 seconds in Q1) and desktop (242 seconds in Q1).
The rate of cart abandonment dropped only slightly from 82% in Q1 to 80% in Q4. As more shoppers increase shopping time on mobile, retailers need to maximize personalization in order to maximize limits to with the product presentation and selection.
Conversion rates for desktop were higher at 2.44% compared with mobile at 1.32% globally, an indication that retailers need to work much harder to increase mobile conversions.
Average order value growing
According to the report: “average order value (AOV) was dominant on desktop at $120 with mobile AOV averaging $103. North America led all other regions on both mobile ($102) and desktop ($96). An interesting phenomenon is the shrinking gap between desktop and mobile AOV in the North American market: mobile AOV is at 94% of desktop AOV and is smallest percentage-wise relative to all other regions.”
Cart abandonment globally was stable at 80% on mobile and 74% on desktop. It’s an area where a combination of better user experience, design, payment choices and personalization can make a big difference in reducing cart abandonment.

All in all, the Nosto report paints a positive picture