

Are you already selling globally or unsure where to start or how to improve your cross-border sales? We’ve got some insight and tips from Shopify Plus that should help you tap into the estimated $3.5 trillion global retail e-commerce market.
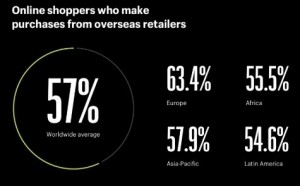
Some 57% of global online shoppers already buy from overseas retailers and it’s even higher in Europe at 63.4%. The numbers are also encouraging in the Asia-Pacific market (57.9%), Africa (55.5%) and Latin America (54.6%).
While you may not have the challenge of warehousing products, any retailer who has tested
Where’s the biggest online sales growth?
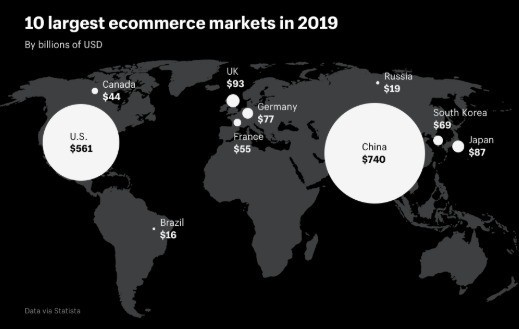
According to Statista, the biggest markets for 2019 are already well-established: China ($740 billion), US ($561 billion), UK ($93 billion), Japan ($87 billion), Germany ($77 billion), South Korea ($69 billion), France ($55 billion), Canada ($44 billion), Australia ($18 billion), and Brazil ($16 billion).
It’s the projected five-year growth figures (2018-2023) that should get online retailers’ attention. They include China (70.7% growth), US (45.7%), France (45.6%), Australia (44.6%), Russian (44.2%), Canada (38.8%), Germany (35.6%), UK (31.3%), Japan (26.8%), and South Korea (25.9%).
The obvious take away is the US global share of e-commerce sales will decrease relative to the growth of other markets. By 2023, Asia-Pacific retail e-commerce sales will total more than $1.4 trillion, while North America, Europe, Africa/Middle East, and South America will total approximately $1.3 trillion.
Tackling China and Asia-Pacific markets
China and other Asian markets present many challenges, including difficult to obtain licenses, government control of internet services, challenging and often-changing regulations, varying online advertising regulations, and the different ways consumers buy online in each region.
The Shopify report suggests several strategies to establish a China market presence:
“Strategies typically cluster around three approaches. First, partnering with local vendors. Second, investing in an on the ground team. Depending on size, this may include localization, marketing, logistics, customer support, sales, and engineering. Third, establishing an online presence through third-party marketplaces — i.e., Tmall and JD — and/or a branded ecommerce site. Branded sites are more costly, but they provide more data and better customer relationships.”
Regional product market differences
It’s no secret. Regional markets favor different product categories and products. In 2018 for example, global online gaming sales grew 3%, groceries online +2%, medicine/health +1%, and alcoholic beverages grew 1%.
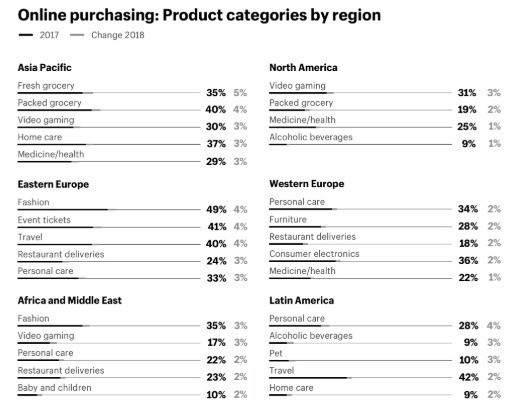
In the Asia-Pacific region, online sales growth categories were fresh groceries +5%, packed groceries +4%, video gaming +3%, home care +3%, and medicine/health +3%.
Biggest online sales growth categories in Eastern Europe were fashion, event tickets and travel each at +4% and restaurant and personal care +3%. In Western Europe, personal care, restaurant deliveries, consumer electronics and furniture were +2%.
In Africa and the Middle East, fashion and video gaming were +3%, while personal care, restaurant deliveries and maybe goods were +2%. Biggest online sales category gains in Latin America included personal care +4%, alcoholic beverages and pet products +3%, and travel and home care +2%.
Once you’ve done product category and marketing tests, then it’s the same challenge of every market – conversions. This means looking at factors such as language, delivery and payment options which may create barriers without careful analysis.
Language & payments options critical
Language and payments choices for shoppers matter. Understandably, 75% of consumers want to buy in their own language. 69% never or rarely buy from an English-only website while 67% prefer navigation and “some” content translated.
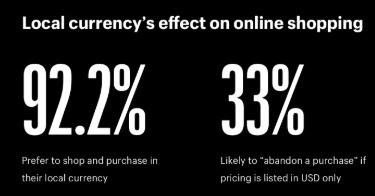
The effect of local currencies and preferred payments choices have an even bigger impact on purchases, according to the report:
“In a study of 30,000 online shoppers, nearly all (92%) said they “prefer” to shop and make purchases on sites that price in their local currency. Even more startling, one-third are likely to “abandon a purchase” if pricing is listed in USD only.”
As we’ve reported many times on Payments NEXT, local payments preferences vary considerably by market. Globally, 53% of online shoppers pay with a credit card, 43% with a digital payment and 39% with a debit card.

In China, 86% pay with digital payment systems, 53% with direct debit and 49% cash on delivery. In India, 83% pay cash on delivery, 71% with a debit card and 61% with direct debit. Across Southeast Asia, 57% pay with credit cards, 37% with digital payment systems, and only 35% with direct debit.
In less developed regions, payment preferences are strikingly different again. In Africa, 54% pay cash on delivery, 52% with debit cards and 42% by direct debit. Cash on delivery ranks high in the Middle East at 64%, 46% have paid with credit cards and only 11% with debit cards. In Latin America, 65% have used credit cards, 41% debit cards and 36% have used digital payment systems.
Contrast this with North America were 74% of paid with credit cards, 38% with digital payment systems like Apple Pay and PayPal, and 26% with store-specific gift cards.
It’s no wonder payment systems are among the biggest barriers for cross-border e-commerce success. Picking the right payments partners critical.
Global B2B e-commerce opportunities
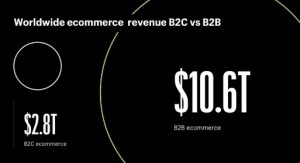
B2B cross-border e-commerce represents a huge new business opportunity. According to Statista, global B2B e-commerce is estimated that more than $10.6 trillion annually, compared to B2C e-commerce and $2.8 trillion.
E-commerce has simply turned the B2B marketplace upside down in the past five years. According to the report:
“Why is B2B ecommerce such a ripe global opportunity? First, B2B marketplaces (e.g., Amazon Business, eWorldTrade, Joor, Alibaba, etc.) operate much like their B2C counterparts. They provide ready-made connections between buyers and sellers. Second, the B2C preference for self-service has infiltrated B2B and alleviated the offline barrier of hiring a large sales force. Gartner found that B2B “customers now wait until they are 57% through the purchase process before contacting a rep.”
If you’re only selling in the US, why wouldn’t you want a piece of that huge global B2B market?
The Shopify Plus analysis of global e-commerce is recommended reading if you are looking to start or grow your cross-border B2C or B2B sales and they have plenty of other resources to assist in your research.
Charts and visuals are provided courtesy of Shopify