Ever wonder how much retailers in your industry earn monthly? What their profit margins are and how many monthly transactions and customers they have?
 A new retail research survey of more than 13,000 global retailers by point-of-sale expert Vend, identifies key benchmarks and provides valuable business metrics for the industry.
Revenue and margins
On average, retail stores made $22,340.88 (USD) per month, with a gross margin of 50.96%. Retailers in Australia ($26,395), New Zealand ($26,475) and the US ($22,430) earned above-average revenue. The UK ($19,223) made slightly less than average.
 Sales are one thing, but margins are where the rubber meets the road. As mentioned, the average retail store had a margin of 50.96%.
The UK, despite lower average monthly sales, had the most profitable margins at 53.12%. North America (51.22%), Australia (50.94%) and New Zealand (50.47%) followed.
By industry, the most profitable retailers were beverages (60.68%), cosmetics & beauty (57.94%), jewelry (56.80%), specialty foods (53.19 %) and furnishings (52.36%). The least profitable retailers included alcoholic beverages (38.91%), electronics (39.31%), sporting goods (42.09%) and hobbies and music (46.19%).
Monthly revenue by industry
Sporting goods ($30,447.91), alcoholic beverages ($38,951.75) and home furnishings stores ($39,572.67) earned the highest average monthly revenue.
The lowest average monthly revenue was earned by cosmetics retailers ($18,644.19), specialty food stores ($20,226.12) and office supplies ($21,343.07).

Transactions and sales metrics
 When it comes to transactions, retailers in the Vend study processed an average of 482 transactions per store each month. Average transaction value was $53.98, and the average basket size was 2.73 items per sale.
New Zealand retailers handle an average of 603.03 transactions monthly followed by the UK (590.85), Australia (506.09) and North America (429.41).
Customer sales benchmarks
The highest average number of items purchased per month, per store by industry included alcoholic beverages (963.11), specialty foods (806.79), beverages (589.32), hobbies and music (541.68) and office supplies (443.83).
On the lower end, furniture stores averaged 151.89 purchases followed by jewelry, luggage, and leather goods stores (190.11) and shoe stores (220.85).
 The value of average transactions by industry is an important competitive measure for retailers.
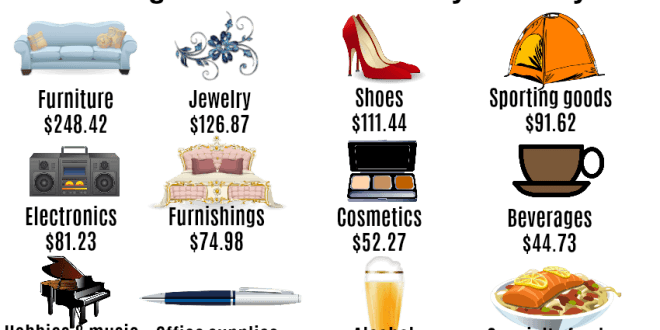
Furniture retailers had the highest transaction value ($248.42) followed by jewelry, luggage, and leather goods stores ($126.87) and shoe stores ($111.44). Meanwhile, specialty food stores had the lowest transaction value at $22.88, followed by beer, wine and liquor stores with $33.12.
Number of customers?
Retailers had an average of 487.96 customers. North America seemed to be the best at collecting customer information; they had an average of 606.28 customers in their database. On the other end are retailers in the UK, with 376.67.
 The retailers with the largest number of customers included cosmetics and beauty (1,121.96), electronics (742.74), shoe stores (741.76), fashion (660.16), jewelry (614.92), furniture retailers (562.06) and alcoholic beverages (540.91).
Retailers with the lowest number of customers were office supplies (284.62), beverages (331.68), specialty foods (367.65), furnishings (371.47) and hobbies and music stores (455.43).
Free retail benchmark report available
 You can get insight into your retail competitors by reading their free retail benchmark report here. In addition to the competitive research, the report also provides expert tips on marketing and growing your customer base.

